Biology Climate Change Project
Essential Question: What are the Biological needs of Adolescents?
Project Description
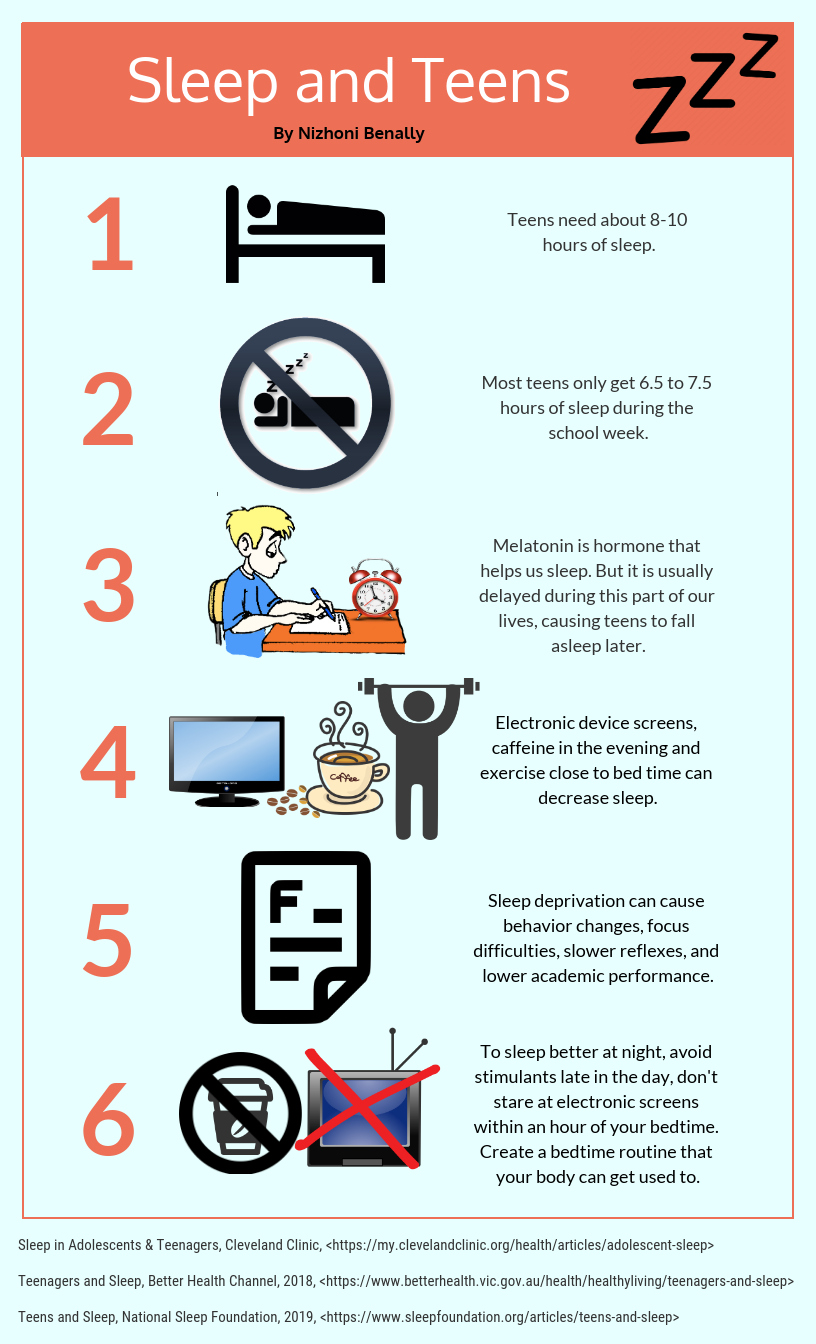
Our assignment was to make an infographic following the essential question “What are biological needs of adolescents?” We could choose any topic, from “How do friends affect adolescents” to “How do drugs affect adolescents”, as long as the topic followed along the lines of the essential question.
After we had chosen our topics, we were to research information on said topic and get at least three resources we can cite from for our infographic. We then were able to start our infographic. Our infographics were meant to be informational on our topic as well as be visually appealing with pictures that related to the topic.
I found this Project important because it showed our ability to find information on a topic and then be able to quickly share it with other people. This assignment has also shown that we can take information and shorten it for less reading, but is still informational about the topic so others can understand.
Personal Reflection
During this project, I struggled to take the information that I learned from my resources and shorten them for the infographic. While I did start out well with keeping the amount of words on my infographic short, I quickly began to struggle with this as I continued on to sections such as, What are the cons of being sleep deprived and How can you go to bed earlier. A lot of my information for sections were either one really long sentence or two sentences.
Even though I did struggle with keeping my information short, I do believe that I did well with getting pictures that related to my topic. I did have some topics that were a bit difficult to find a picture, but I would eventually find a picture that relates to the topic in some way. For some of the sections, I would use a series of pictures to represent more of the topics of that section.
If I were to do this project again, I wouldn’t change much. There are small things I could change I were to do this again, like trying to shorten the information or maybe find better pictures for some of my sections. But I would definitely try different colors for my infographic as the current color scheme for my infographic doesn’t really appeal to me and I would add a graph or pie chart to better graph my information for people.
